
What is liquidity and why is it important?
Global Liquidity
Shadow Monetary Base
GLI™ World Aggregate July 2026

The importance
of Liquidity

Understanding Liquidity is the key to understanding risk. The Global Liquidity Index (GLI™) series compiled by firm are widely-used, key alternative indicators which measure financial and economic conditions across some 80 countries Worldwide. The GLI™ provide a consistent and dependable measure of financial conditions market-by-market.
They precede general business and market cycles and highlight the contributions from different liquidity providers. By collecting more than 30 data series reported by Central Banks, National Treasuries and private sector institutions across some 80 countries around the world every month, the GLI™ represent the most comprehensive survey of liquidity and credit conditions available to professional investors and advisors.

The GLI™ predict movements in international fixed income, equity, credit, currency, futures and options markets. They typically lead business cycles by around 12-15 months and financial asset prices by 3-6 months. Economists, analysts, strategists and portfolio managers in banks, asset management firms, hedge funds and corporate treasury departments all need to watch these data. Data are published in a timely fashion, typically within 10 days of each month-end and give a very early indication of business and credit conditions at that point in time.
GLI™ headline data are designed to provide snapshots of financial and credit conditions and are lead indicators of future economic activity. Data are comprehensive, covering liquidity conditions across all 80 key economies in the developed, emerging and frontier market universe. The monthly GLI™ data have two levels: (1) the headline global and national GLI™ release is designed to provide an overview of financial liquidity conditions at each month end; (2) sub-component data detail the key Central Bank, private sector and foreign flow building blocks. The GLI™ indices are homogeneous in both content and methodology. They are based on reported data or facts, and not on forecasts or opinions. They are expressed both as normalised data in local currency terms and in US dollar value terms, and thus offer unique cross-market comparisons. Our database typically starts for most economies in 1974.
Global coverage
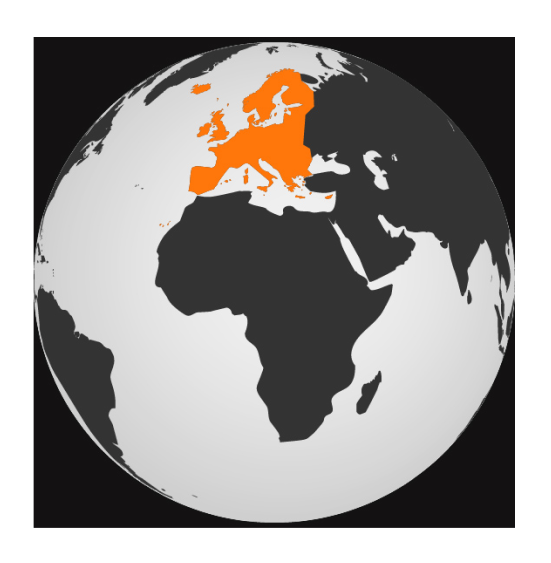
GLOBAL
Argentina, Australia, Austria, Bangladesh, Belgium, Brazil, Canada, Chile, China, Colombia, Czech Republic, Denmark, Egypt, Finland, France, Germany, Greece, Hong Kong, Hungary, India, Indonesia, Ireland, Israel, Italy, Japan, Jordan, Korea, Kuwait, Malaysia, Mauritius, Mexico, Morocco, Netherlands, New Zealand, Norway, Pakistan, Peru, Philippines, Poland, Portugal, Russia, Singapore, South Africa, Spain, Sri Lanka, Sweden, Switzerland, Taiwan, Thailand, Turkey, UK, US, Venezuela, Zimbabwe
Eurozone
Austria, Belgium, Finland, France, Germany, Greece, Ireland, Italy, Netherlands, Portugal, Spain, Sweden, Switzerland.
Latin America
Argentina, Brazil, Chile, Colombia, Mexico, Peru, Venezuela.
Emerging
Bangladesh, Egypt, India, Indonesia, Jordan, Kuwait, Malaysia, Morocco, Pakistan, Philippines, Russia, South Africa, Turkey.
Emerging Asia
China, Hong Kong, Korea, Singapore, Taiwan, Thailand.
Major Commodity Producers
Australia,| Botswana, Brazil, Canada, Chile, Colombia, Indonesia, Kazakhstan, Kuwait, Malaysia, Mongolia, New Zealand, Nigeria, Norway, Qatar, Russia, Saudi Arabia, South Africa, Ukraine, United Arab Emirates, Venezuela, Zimbabwe
Frontier
Botswana, Bulgaria, Croatia, Estonia, Ghana, Kazakhstan, Kenya, Lithuania, Mongolia, Myanmar, Nigeria, Qatar, Romania, Saudi Arabia, Serbia, Slovenia, United Arab Emirates, Ukraine, Vietnam
A risk-based investment
process
GL Indexes implements a proprietary risk-based approach that employs a systematic quantitative model. This is designed to more easily integrate into your investment process by providing an extra level of screening. Our methodology and evaluations have been independently studied and verified by Dassault Systemes, the risk consultants.

Traffic light warning systems and data heat maps visually display alerts to clients. We monitor and separately publish data on three key risk channels: (1) liquidity risk; (2) forex risk and (3) market exposure risk. These are combined into a Composite Risk Index, which is published, within 10 days of each month-end. To assess risk, the firm tracks capital flows, watches Central Banks and digs into credit markets. The methodology derives from a comprehensive study of flow of funds data and incorporates our belief is that changes in the sources of funds (i.e. financial flows) are often more important than the uses of funds (i.e. economic spending categories). This is true by definition at major inflections in the funding cycle, which we measure through our monthly GLI™ (Global Liquidity Indexes). These indexes comprise measures of Central Bank, Private Sector and net cross-border capital flows: we sample more than 30 data series for each of 80 economies World-wide, covering banks, Central Banks, shadow banks, corporations, households and foreign investors to unambiguously assess liquidity conditions.

Our conclusions are expressed in three ways: (1) credit markets depend on the ability to re-finance positions (liquidity/re-financing risk) and are therefore determined by the volume of liquidity; (2) forex markets depend upon the quality as well as the quantity of liquidity, and specifically on the difference between our indexes of Private Sector and Central Bank Liquidity (forex risk), and (3) investment performance depends, in part, on both these credit risk and forex risk factors as well as a third factor market exposure risk, which measures the extent that existing portfolios are skewed, or not, towards risk assets and therefore implicitly includes greater or less default risk and maturity risk. In summary, liquidity risk is most important for bond and credit markets; forex risk determines currency markets, and exposure risk is key for risk assets, such as equities and credits. These risk factors are optimally combined using machine-learning technology into a Composite Risk Index.